BI Blog
What Investors Actually Check in Your TAM, SAM, and SOM Before They Fund You
A seed-stage investor spends about three minutes and forty-four seconds on the first read of a pitch deck, and only 58 percent of decks get viewed to completion, according to DocSend’s own published data on seed deck reviews. If your deck survives that skim, the market-size slide you spent three weeks building rarely gets read line by line in the room. It gets filed away as “big enough,” and then it comes back later, in a follow-up call, in a diligence memo, in a message asking your co-founder to walk through exactly how you got to that number. That second conversation, not the slide itself, is where most TAM, SAM, and SOM claims fall apart.
The quick skim is not the real test
The pitch deck benchmarks are consistent on one point: the first pass is fast and forgiving, the second pass is slow and skeptical. Storydoc’s analysis of 1.3 million deck-viewing sessions found that 31 percent end within the first ten seconds, while 82 percent of the sessions that make it past the first three slides go on to finish the whole deck, meaning a deck has to earn its way past an early drop-off before anyone reads your numbers closely at all. Papermark’s 2024 dataset, built from 3,000 pitch decks and about 8 million data points, puts full-deck review time at roughly 3.2 minutes, with about fifteen seconds spent per slide after the first, the market-size slide included.
Fifteen seconds is enough time to register a number. It is not enough time to check it. The checking happens afterward, when an associate or partner opens a spreadsheet, pulls up your deck again, and starts asking where the number came from. That is the moment a TAM SAM SOM slide either holds up or does not, and it has very little to do with how the slide looked.
What investors actually check once they slow down
Angel and venture due diligence on market size tends to follow a consistent pattern, documented in investor guides such as Holloway’s angel investing series. Four checks come up repeatedly.
Whether the method is disclosed, not just the number. A slide that states a dollar figure with no visible path to it reads as a guess. Investors ask founders to walk through the calculation live, and the walk-through itself is often the real test, not the final figure.
Whether the market is defined as the product’s market, not the industry’s market. A founder selling a narrow tool inside a large industry will sometimes size the whole industry instead of the specific spend their product can realistically capture. Investors who have seen this before ask a direct question: which exact budget line, inside which exact buyer, does your revenue come out of.
Whether the customer or usage numbers behind the model are the real thing. If the model assumes a certain number of existing customers, a growth rate, or a price point, investors will ask how those inputs were measured and whether they hold up under a second look, not just whether they sound reasonable on the slide.
Whether the number is checkable against something real. Analogous products, public filings, industry reports, signed letters of intent. A number with no external anchor is harder to trust than a smaller number with three independent ways to verify it.
Why investors run two methods instead of one
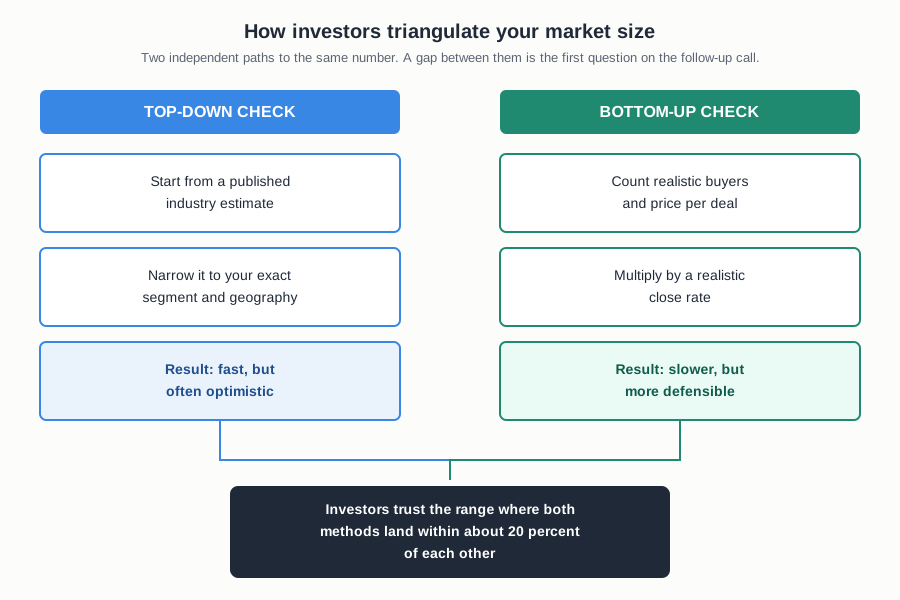
Top-down sizing starts from an existing industry estimate and narrows it down with filters for segment, geography, and use case. It is fast to build and it is the method most first-time founders reach for, because the raw numbers already exist in an analyst report somewhere. Its weakness is that it inherits every assumption baked into that original report, and narrowing a large number with a few percentage filters can make almost any market look big enough.
Bottom-up sizing starts from the buyer instead of the industry: a realistic count of likely customers, a realistic price per deal, and a realistic close rate, multiplied up into a dollar figure. It takes longer to build because it forces someone to defend each input individually, but that is also why investors tend to trust it more. A bottom-up number cannot hide behind an industry report’s assumptions, because it has none to hide behind.
Used together, the two methods work as a check on each other. When a top-down estimate and a bottom-up estimate land within roughly 20 percent of one another, most investors treat that convergence as a credible range worth taking seriously. When they land far apart, the gap itself becomes the first question on the follow-up call, and whichever founder cannot explain it loses time, and sometimes loses the deal.
Three things that make a TAM SAM SOM credible under questioning
Across the pattern above, a market-size claim that survives diligence tends to share three traits. The method is named and shown, not hidden behind a single number. The top-down and bottom-up figures are close enough to each other that the gap does not need a separate explanation. And every input, whether it is a price, a customer count, or a growth rate, is sourced to something a stranger could go check without taking the founder’s word for it.
None of this is about making the market look bigger. It is about making the number survive contact with someone whose job is to find the weak point in it before they write a check.
If you are preparing to raise
A market-sizing model is strongest when it is built by someone whose job is not also to pitch the round, since every founder has a natural incentive to round the number up. This is the core of what independent investor pitch deck research looks like in practice: BI Company builds top-down and bottom-up market-size estimates for startups preparing to raise, sourced and triangulated the way the checks above describe, so the number in the deck is the same number that holds up on the follow-up call. Request a market size calculation to see how this works for your specific market, or read more about how this fits into earlier-stage market research for startups.
A credible TAM SAM SOM slide earns you a second conversation. It does not replace the evidence that conversation will eventually ask for, things like real customer interviews, a tested price point, and proof that the problem you are solving is one people will actually pay to fix. That is a separate body of work from market sizing, closer to what we cover in the founder’s formula, and worth lining up before the number on the slide gets tested in the room.
Frequently asked questions
Should a seed-stage startup use top-down or bottom-up market sizing?
Both, if there is time to build each one properly. Top-down is faster and useful for an early directional number. Bottom-up takes longer but is what investors tend to trust more, since it is built from assumptions that can be checked one at a time rather than inherited from someone else’s industry report.
How big does a TAM need to be for investors to take it seriously?
There is no single threshold that applies across every sector, and a number chosen to hit a round figure is a bigger red flag than a smaller, well-sourced one. What investors consistently reward is a number that is defensible under questioning, not a number that is large.
What is the “20 percent rule” investors use to sanity check a TAM?
It is not a formal rule, more a working heuristic some investors apply: when an independently built top-down estimate and bottom-up estimate land within roughly 20 percent of each other, that convergence is treated as a signal the market size is grounded in something real rather than picked to look impressive.
Request a Free TAM SAM SOM Calculation
Sources
- DocSend, seed pitch deck review-time and completion-rate data, published on the DocSend blog
- Papermark, Pitch Deck Metrics report, data collected January to December 2024 across 3,000 pitch decks
- Storydoc, presentation and pitch deck engagement statistics, based on an analysis of 1.3 million viewing sessions
- Holloway, Angel Investing guide, section on due diligence for market size claims